
Getting started. Free tools to optimise your trading setup so that you save time and trade smarter:

So far, we've discussed the MT4 trading platform, the strategy, helped you find the best broker, and now it's time to help you set up your platform like a pro, so that the charts looks better and so that you save time. This includes free tools that you can easily download from this page.
Here are the 4 important points and tools I'm going to cover here:
1) The 6 currency pair charts you need to have at your fingertips,
2) The chart template you should use, so that the chart is easier to "read" and easier on your eyes,
3) A powerful timeframe "indicator" you should use, that allows you to see a currency pair's performance over the various timeframes in one glance, without having to toggle back and forth between timeframes,
4) Powerful scripts that will save time, so that you don't have to mentally calculate Stop Loss and Take Profit levels when you are updating an order (or a pending order),
5) Market hours, market holidays, and major news events.
1) The 6 currency pair charts you need to have at your fingertips
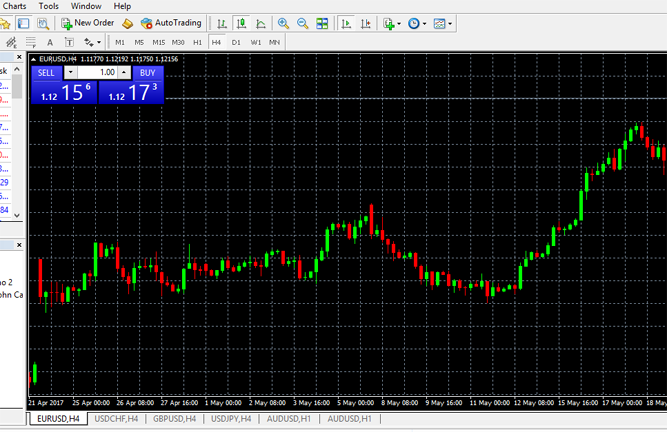
When you first launch MT4, you will see 4 small charts that are already open (EUR/USD, USD/CHF, USD/JPY, GBP/USD). You can minimise them, or pick one and maximise it so that it takes up the full screen area. You can then easily access them via the tabs below You never want to look at more than one chart at a time, and when you look at a chart, it should always take up all of the screen. You should also add 2 other major pairs, so that you have the 6 major pairs (which have greater trading volume and therefore offer more opportunities): the USD/CAD and the AUD/USD. You can add them via the green "+" icon at the top left of MT4 or in the MT4 menu: File + New Chart.
2) A free chart template that's easier to read
When you first open MT4, the 4 charts you see are a mix of bar charts and candlestick charts, and some of them feature unecessary indicators. If you agree that the below chart seems easier to read, and you want to easily ensure that your 6 pairs have this same look, simply download our free template.
You can easily load this template onto your platform, just follow the following steps:
1) Right-click anywhere inside one of your charts and select "Template" + "Load Template..."
2) Right-click on one of the templates that appears within the list and select "Properties".
3) Copy the entire location that appears. For example, on my computer it displays:
C:\Users\user\AppData\Roaming\MetaQuotes\Terminal\E6734F6041F45FBC490D7BD7FB1CB8E3\templates
4) Next, download the template here and save it to the location you just copied (do a Ctrl+V to paste the location you copied in the previous step). Copy the address onto a Word doc or a notepad for future reference (it might be useful if you want to add the indicator and scripts which I also recommend further down on this page).
5) Repeat step 1.
6) Double click on "Become-a-TraderTEMPLATE.tpl"...you're done for this 1st chart.
Now you simply need to repeat steps 1 and 6 on your other charts.
The advantage of this chart is that it's a lot easier to read - green means the price went up during that time increment, red means it went down.
If you want to get rid of that obnoxious blue (or red) Sell/Buy feature in the upper left of your chart, simply right-click and select "One Click Trading" to make it disappear. I prefer to place new orders (and pending orders) using the big "+ New Order" icon in the upper menu.
3) A powerful free timeframe "indicator" that will save your time!
On the forex strategy page, I discussed the importance of making sure that you've identified a genuine trend in order to buy or sell in the general direction. I mentioned that you should look at the various timeframes of the currency pairs to find one that is trending. However, switching between timeframes is a time-consuming task that you can completely eliminate with my free indicator, which looks likes this and has a different colour depending on the market's direction in each time frame (again, green=rising, red=declining):
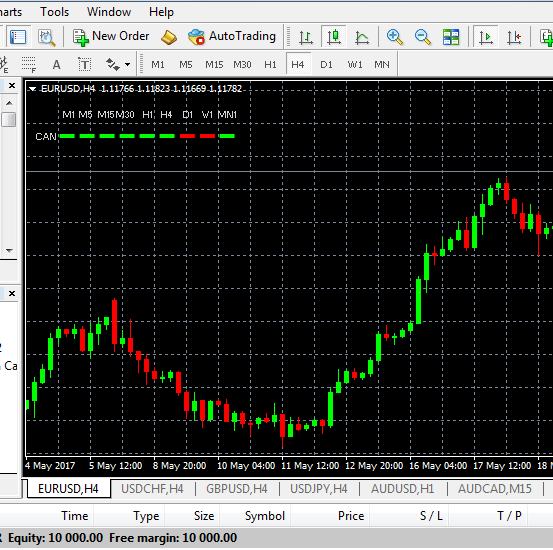
As you can see in the above example, even though we are in the EUR/USD's 4-hour timeframe window, the indicator displays in real time the current market direction of ALL timeframes. Judging by the above example, this is not an ideal setting for a new trade. Remember, at the very least, your 15-min/1-hour/4-hour/Daily timeframes should all be going in the same direction; in the above example de daily candle in the indicator is red, so you would either wait for it to turn green, or simply check the other 5 pairs.
To install this indicator:
1) Go back to the template folder you were in when you installed the template.
2) Navigate up to the folder that is one level above and then go into the MQL4 folder + go into the Indicators folder + right-click on any of the indicators there and copy the location. Mine looks like:
C:\Users\buru\AppData\Roaming\MetaQuotes\Terminal\E6734F6041F45FBC490D7BD7FB1CB8E3\MQL4\Indicators 3) Next, download the indicator here and save it to the location you just copied (do a Ctrl+V to paste the location you copied in the previous step).
4) Relaunch MT4.
5) From the MT4 menu: Insert + Indicators + Custom + Become-a-TraderMulti_Meter_Candle_Color + OK
4) A free script that automates the setting of Stop Loss and Take Profit levels
Although calculating and setting the stop loss and take profit levels is relatively easy once you get the hang of it, this task quickly becomes tedious as you will find yourself constantly doing it for each order and each pending order. There is a way to automate this task so that you don't need to calculate these levels each time.
To install the 2 scripts:
1) Go back to the template folder you were in when you installed the template.
2) Navigate up to the folder that is one level above and then go into the MQL4 folder + go into the Scripts folder + right-click on any of the scripts there and copy the location. Mine looks like:
C:\Users\user\AppData\Roaming\MetaQuotes\Terminal\E6734F6041F45FBC490D7BD7FB1CB8E3\MQL4\Scripts 3) Next, look at the price on your EUR/USD chart. If it has 5 digits after the decimal, download the Stop Loss script here and the Take Profit script here and save each one to the location you just copied (do a Ctrl+V to paste the location you copied in the previous step). If it has 4 digits after the decimal, download the Stop Loss script here and the Take Profit script here and save each one to the location you just copied (do a Ctrl+V to paste the location you copied in the previous step).
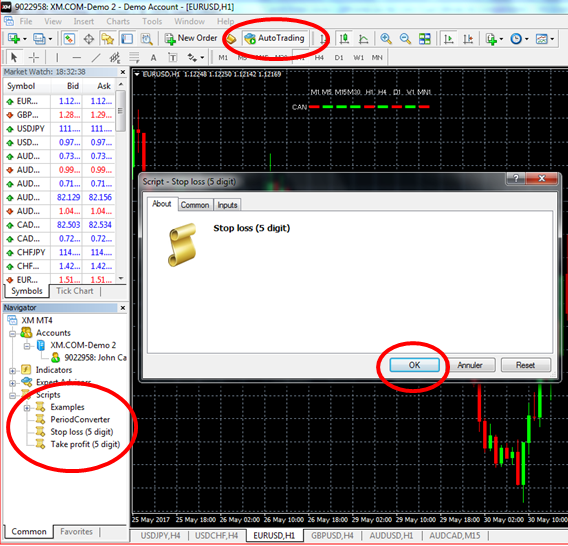
4) Hit the "Auto Trading" button in the upper menu on your MT4 platform (upper red circle in below image).
5) Relaunch MT4.
Now, whenever you're looking at a chart, you can click on the Stop Loss at the left of your screen in the Navigator section (red circle on left in below image; do a Ctrl+N to make it appear if you don't see it) + hit OK and the stop loss level will automatically set itself on all orders related to the chart you're looking at. For example, if you do this when the EUR/USD chart is open, the stop loss will set for the open trade AND the pending order you set. Thanks to this, all you need to calculate are the buy stop and sell stop prices (actually, if you run the script right after you place your first order, all you need to do is look at the resulting Stop Loss level to see what price you need to enter for your pending Buy Stop or Sell Stop order, so you actually don't need to calculate anything at all!).
The same holds true regarding the take profit level script at the left of your screen.
5) Market hours, market holidays, and major news events
The last thing you need to know is when the markets will be most active. The last thing you want to do is launch a trade during a slow market, as this will expose you to a ranging situation where the price isn't going in any decisive direction, it's just bouncing up and down within a channel.
With this in mind, here are 3 very important things you need to remember:
1) the best time to trade is during the London session, especially as it overlaps with the end of the Tokyo session and the beginning of the New York session.
2) be aware of major economic news announcements, as they tend to result in a few minutes of very volatile trading. Your trades are likely to hit a Take Profit level (in which case you need to cancel a pending trade) or Stop Loss (in which case you need to set up a new pending trade),
3) be aware of major US and European holidays, as trading is slow and not appropriate for our strategy,
4) don't launch any new trades on Fridays! Lots of money managers (hedge funds, banks, institutional traders, etc.) like to close their positions before the weekend, so weekends tend to be slow. Also, Monday mornings can sometimes witness surprise opening jumps that bypass Take Profit and Stop Loss levels. This translates into unecessary risks and unwanted stress. Just take Friday off unless you need to monitor open trades that you launched earlier during the week.
The below indicators will help you with the 3 first points, keep this page handy when you're trading, it will help you avoid unecessary trades (sometimes the best thing you can do is stay OUT of the markets) and ensure that no news report takes you by surprise.
1) TRADING HOURS
2) ECONOMIC NEWS CALENDAR (be on the lookout for BIG report releases)
3) BANK HOLIDAYS (avoid!)